Background
This mixed arable and grassland holding in the Vale of White Horse runs to around 450 acres — spring barley (Evelina variety), a winter oat block, grass leys, herbal leys, and permanent pasture enrolled in SFI and CSS agri-environment schemes. Thirteen fields in total.
Going into May, there was some concern around uneven crop establishment. The farm manager wanted a clearer picture of where the variability was sitting before committing to any late-season inputs. Rather than spending a day walking fields on instinct, they commissioned a whole-farm multispectral survey.
The Survey
Flown using a DJI Mavic 3 Multispectral (M3M), capturing five spectral bands including red-edge and near-infrared. DJI Terra processed the imagery into per-field index maps covering NDVI, NDRE, GNDVI, and OSAVI. Field boundaries digitised in QGIS were used to mask each raster to the true field edge, stripping out roads, hedgerows, and anything non-crop related before analysis.
Total surveyed area: 109.5 ha across 13 fields, flown in a single morning.
What the Data Revealed
The Good News First
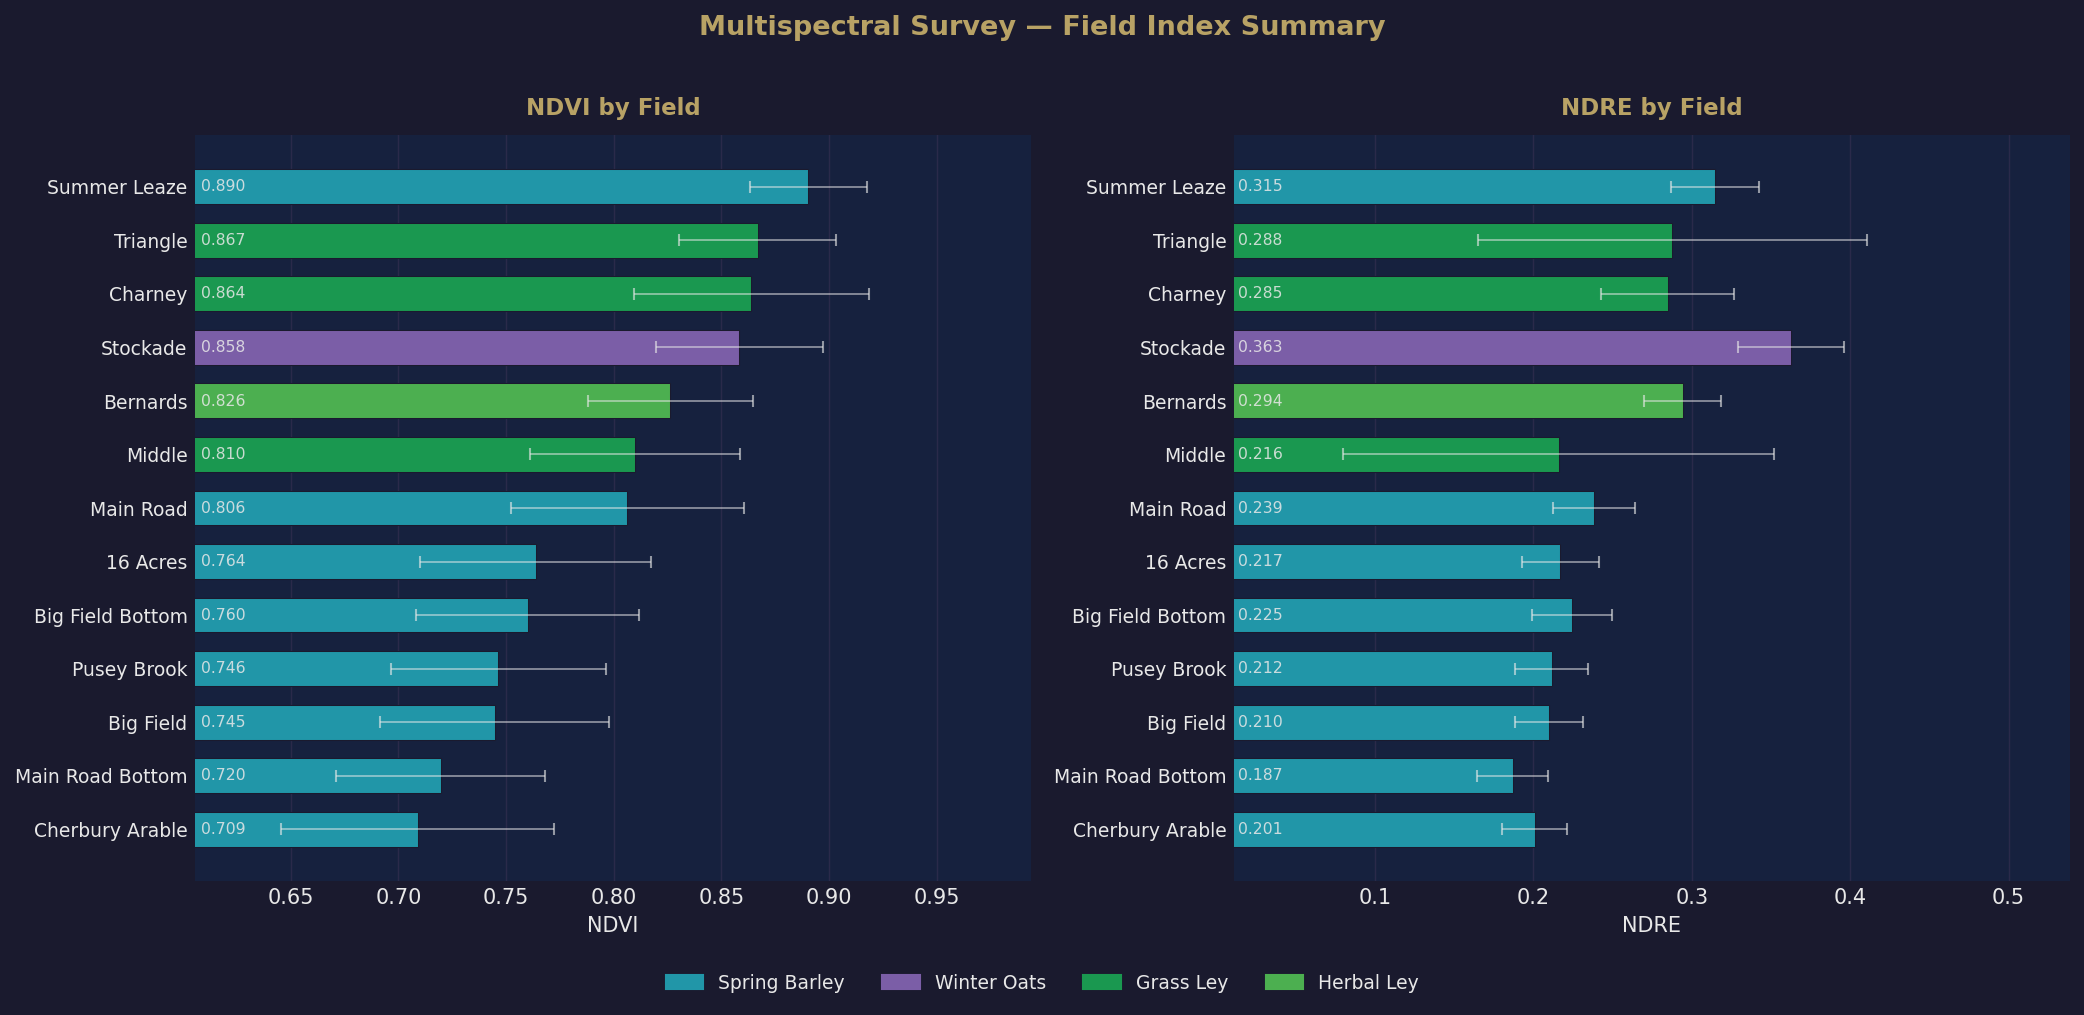
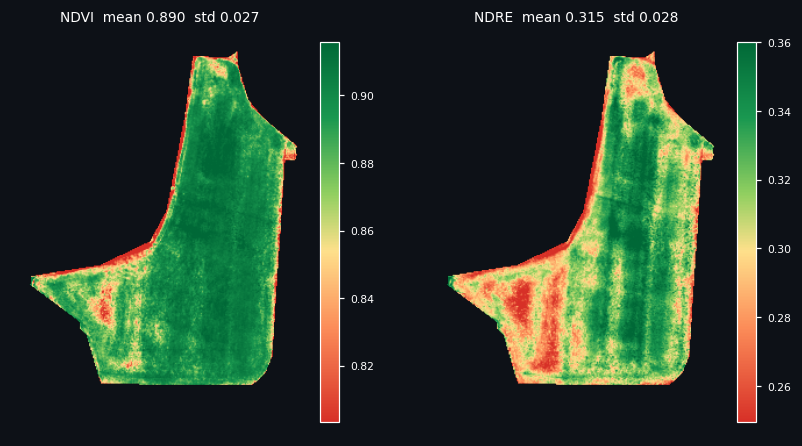
The grassland and ley fields came back strong across the board — NDVI above 0.85 with low within-field variation, indicating even sward establishment and healthy growth. The best-performing spring barley field had 98% of its area in the good vigour band with a tight, uniform distribution. That kind of result matters: it gives you a confident reference point for interpreting everything else.
Two Fields Flagged for Immediate Attention
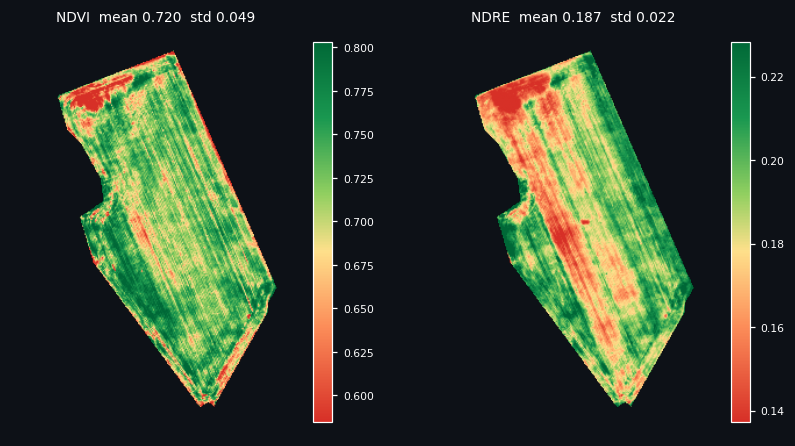
Two spring barley fields stood out. One had 46% of its area below the minimum acceptable NDVI threshold and a low NDRE reading — that combination points toward nitrogen deficiency or significant crop stress, not just slow emergence. The second had the lowest NDVI on the farm and the second-lowest NDRE.
What made this more useful than a headline number was the spatial structure underneath it. The stress wasn't spread evenly — it was sitting in identifiable zones. One field showed a clear north-south gradient in the index values, which is consistent with a drainage issue or a soil type change across the field. That shifts the conversation from "this field is struggling" to "here's where in the field you need to go, and here's the kind of thing you might be looking for."
The BYDV Situation
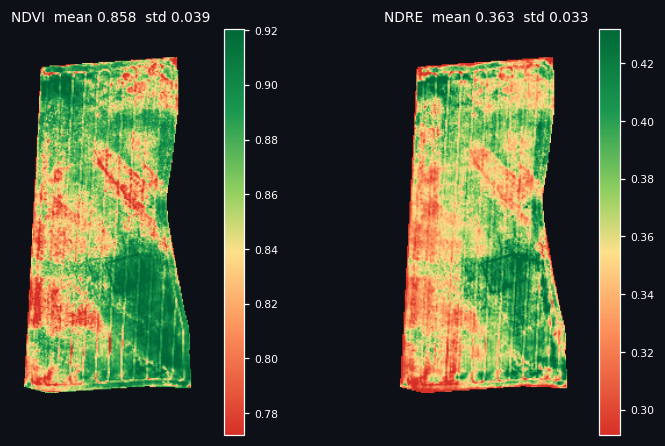
The winter oat field returned the highest NDRE reading on the farm. At first glance that looks like good news. It wasn't.
BYDV infection had already been confirmed on the ground before the survey was flown. The reason the indices look strong is that NDVI and NDRE measure canopy density and chlorophyll — they don't pick up the anthocyanin pigmentation that BYDV causes, because that absorbs in the blue-green spectrum rather than the red/NIR bands the indices rely on. By late spring the crop had put on dense canopy growth in the less-affected areas, which pulled the aggregate numbers up. The spatial patchiness is visible in the map if you know what you're looking at, but the disease itself wasn't detectable from the air.
It's worth being upfront about this: drone indices detect the effects of stress on canopy structure. They don't tell you the cause. Ground truthing is always part of the picture, not an optional extra.
With infection already established the data becomes a useful tool for managing expectations in terms of expected yield and how to prepare for the following season.
Grassland and Leys
All the grass and herbal ley fields showed strong, uniform index values. In an agri-environment context — where sward quality and composition are tied to scheme payments — having objective, dated documentation of field condition has value that goes beyond the immediate cropping season.
What Happened Next
The report was delivered to the farm's agronomist before their next scheduled visit. Rather than arriving with a list of thirteen fields to work through, they could walk straight to the two flagged fields with a specific brief: targeted soil and crop sampling in the zones the spatial analysis had identified.
That's a meaningful difference in practice. An agronomist visit to a 450-acre holding without any prior data can easily absorb a full day — covering ground methodically, relying on experience and eye, hoping to find the right areas. With the survey report in hand, the visit had direction before it started. The two problem fields were already identified. The areas within those fields worth sampling were already mapped. The oat field situation was documented and understood. What remained was confirmation and diagnosis, not discovery.
It also meant the agronomist came to the visit with questions rather than starting from scratch — which fields had a north-south gradient that might suggest a drainage problem worth investigating? Which ones showed low NDRE consistent with nitrogen stress versus fields where the low vigour might be structural? That framing changes the quality of the conversation on the ground.
For farms not yet using variable rate application technology, this is where drone surveying earns its keep — not in driving automated prescriptions, but in making the people involved more effective with the time they have.
Data delivered
- Full PDF survey report with field-by-field index analysis, area breakdown by vigour band, spatial gradient commentary, and NDVI distribution histograms
- Per-field NDVI and NDRE map images
- GeoTIFF index rasters for all 13 fields (NDVI, NDRE, GNDVI, OSAVI), ready for import into precision agriculture platforms
Survey flown and processed by McLaren Precision Agriculture Ltd. Client details withheld at the farm's request.