Weed detection is now available as a standard MPA service — [find out more](/services/weed-detection).
Background
Rye grass is a zero-tolerance problem on most arable farms. A single plant sets tens of thousands of seeds, and those seeds persist in the soil for years — so a light infestation that gets to set seed compounds quickly. The usual response is whole-field herbicide treatment, which works, but it doesn't make any distinction between a field that's 1% affected and one that's 30% affected. On a farm with an already difficult resistance picture, that's not a calculation you want to keep running indefinitely.
The farm came to us wanting a map of where the rye grass actually was, precise enough to drive a sprayer prescription.
The survey
Flown on the DJI Mavic 3 Multispectral at approximately 1.75 cm ground sampling distance on the multispectral bands, with a simultaneous true-colour RGB ortho at around 1 cm. The flight was cut short by RF interference from a nearby telecoms mast, so the survey covers around 85% of the intended field area. A short supplementary flight will pick up the remaining strip.
The detection method
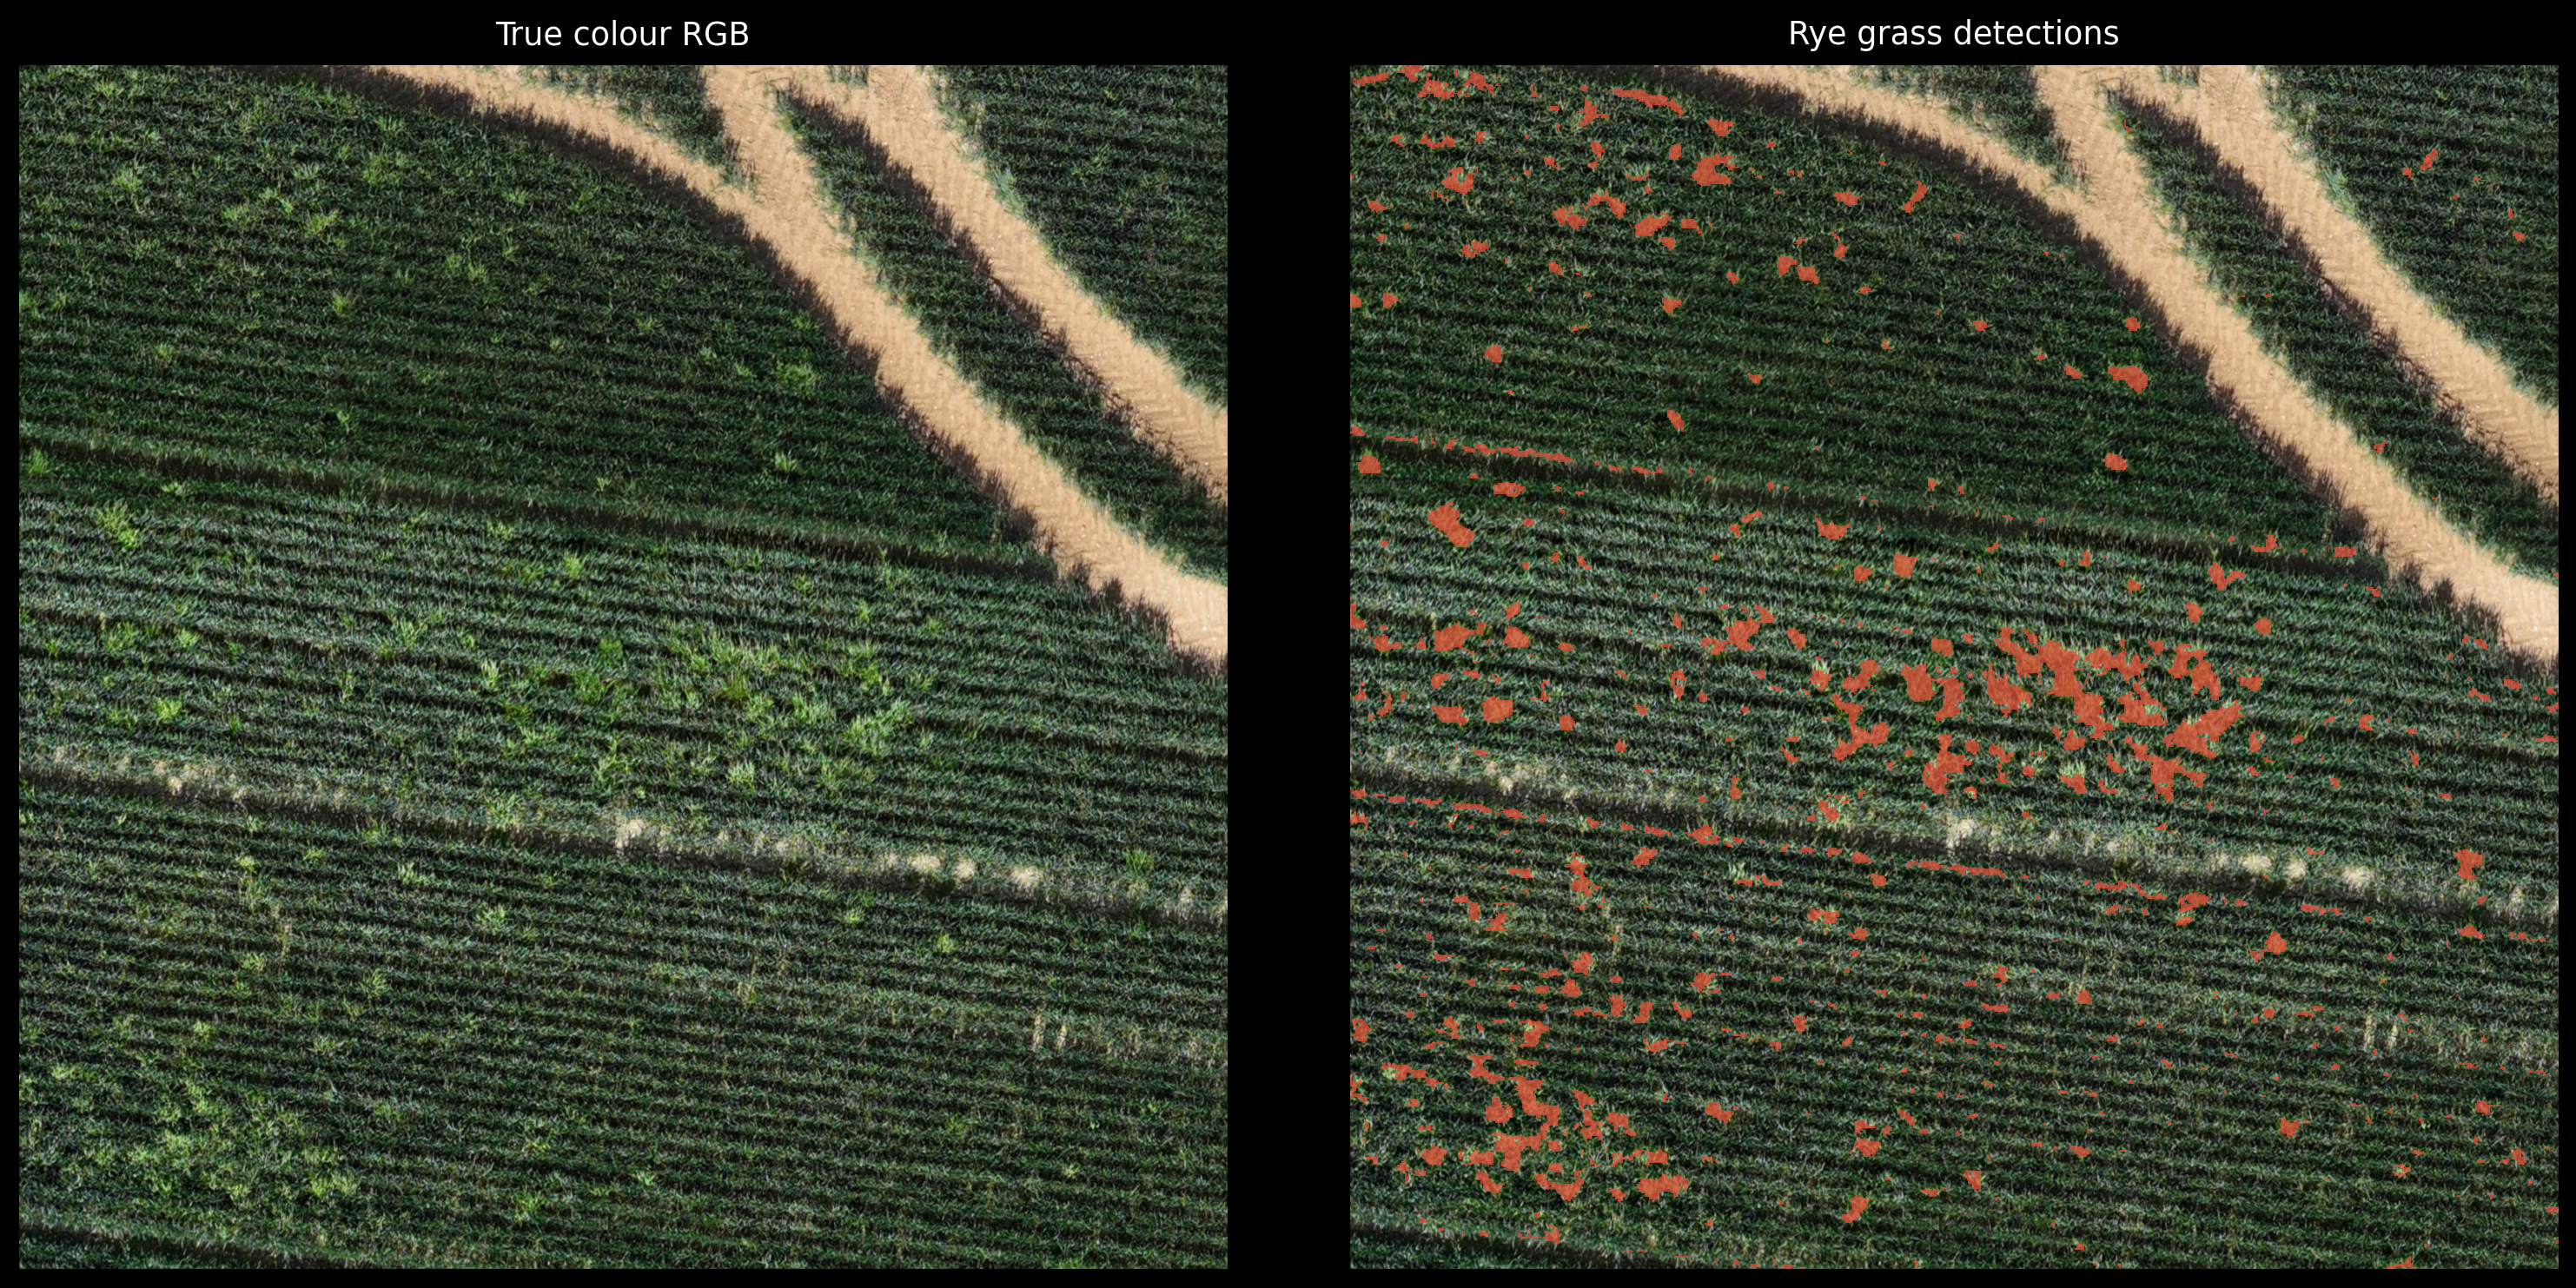
Detection is carried out using bespoke software developed by McLaren Precision Agriculture, built around the measurable spectral differences between rye grass and winter wheat — differences that are visible in both the multispectral bands and the true-colour imagery, and that hold consistently across the canopy at this resolution. The approach works at the level of small canopy patches rather than individual pixels, which is what makes it robust to the leaf-level variation that causes problems for simpler thresholding methods.
The output was validated directly against the true-colour ortho at full resolution before delivery, with false detections identified and the analysis refined accordingly. Every detection in the final output has a specific, auditable spectral basis.
What the data revealed
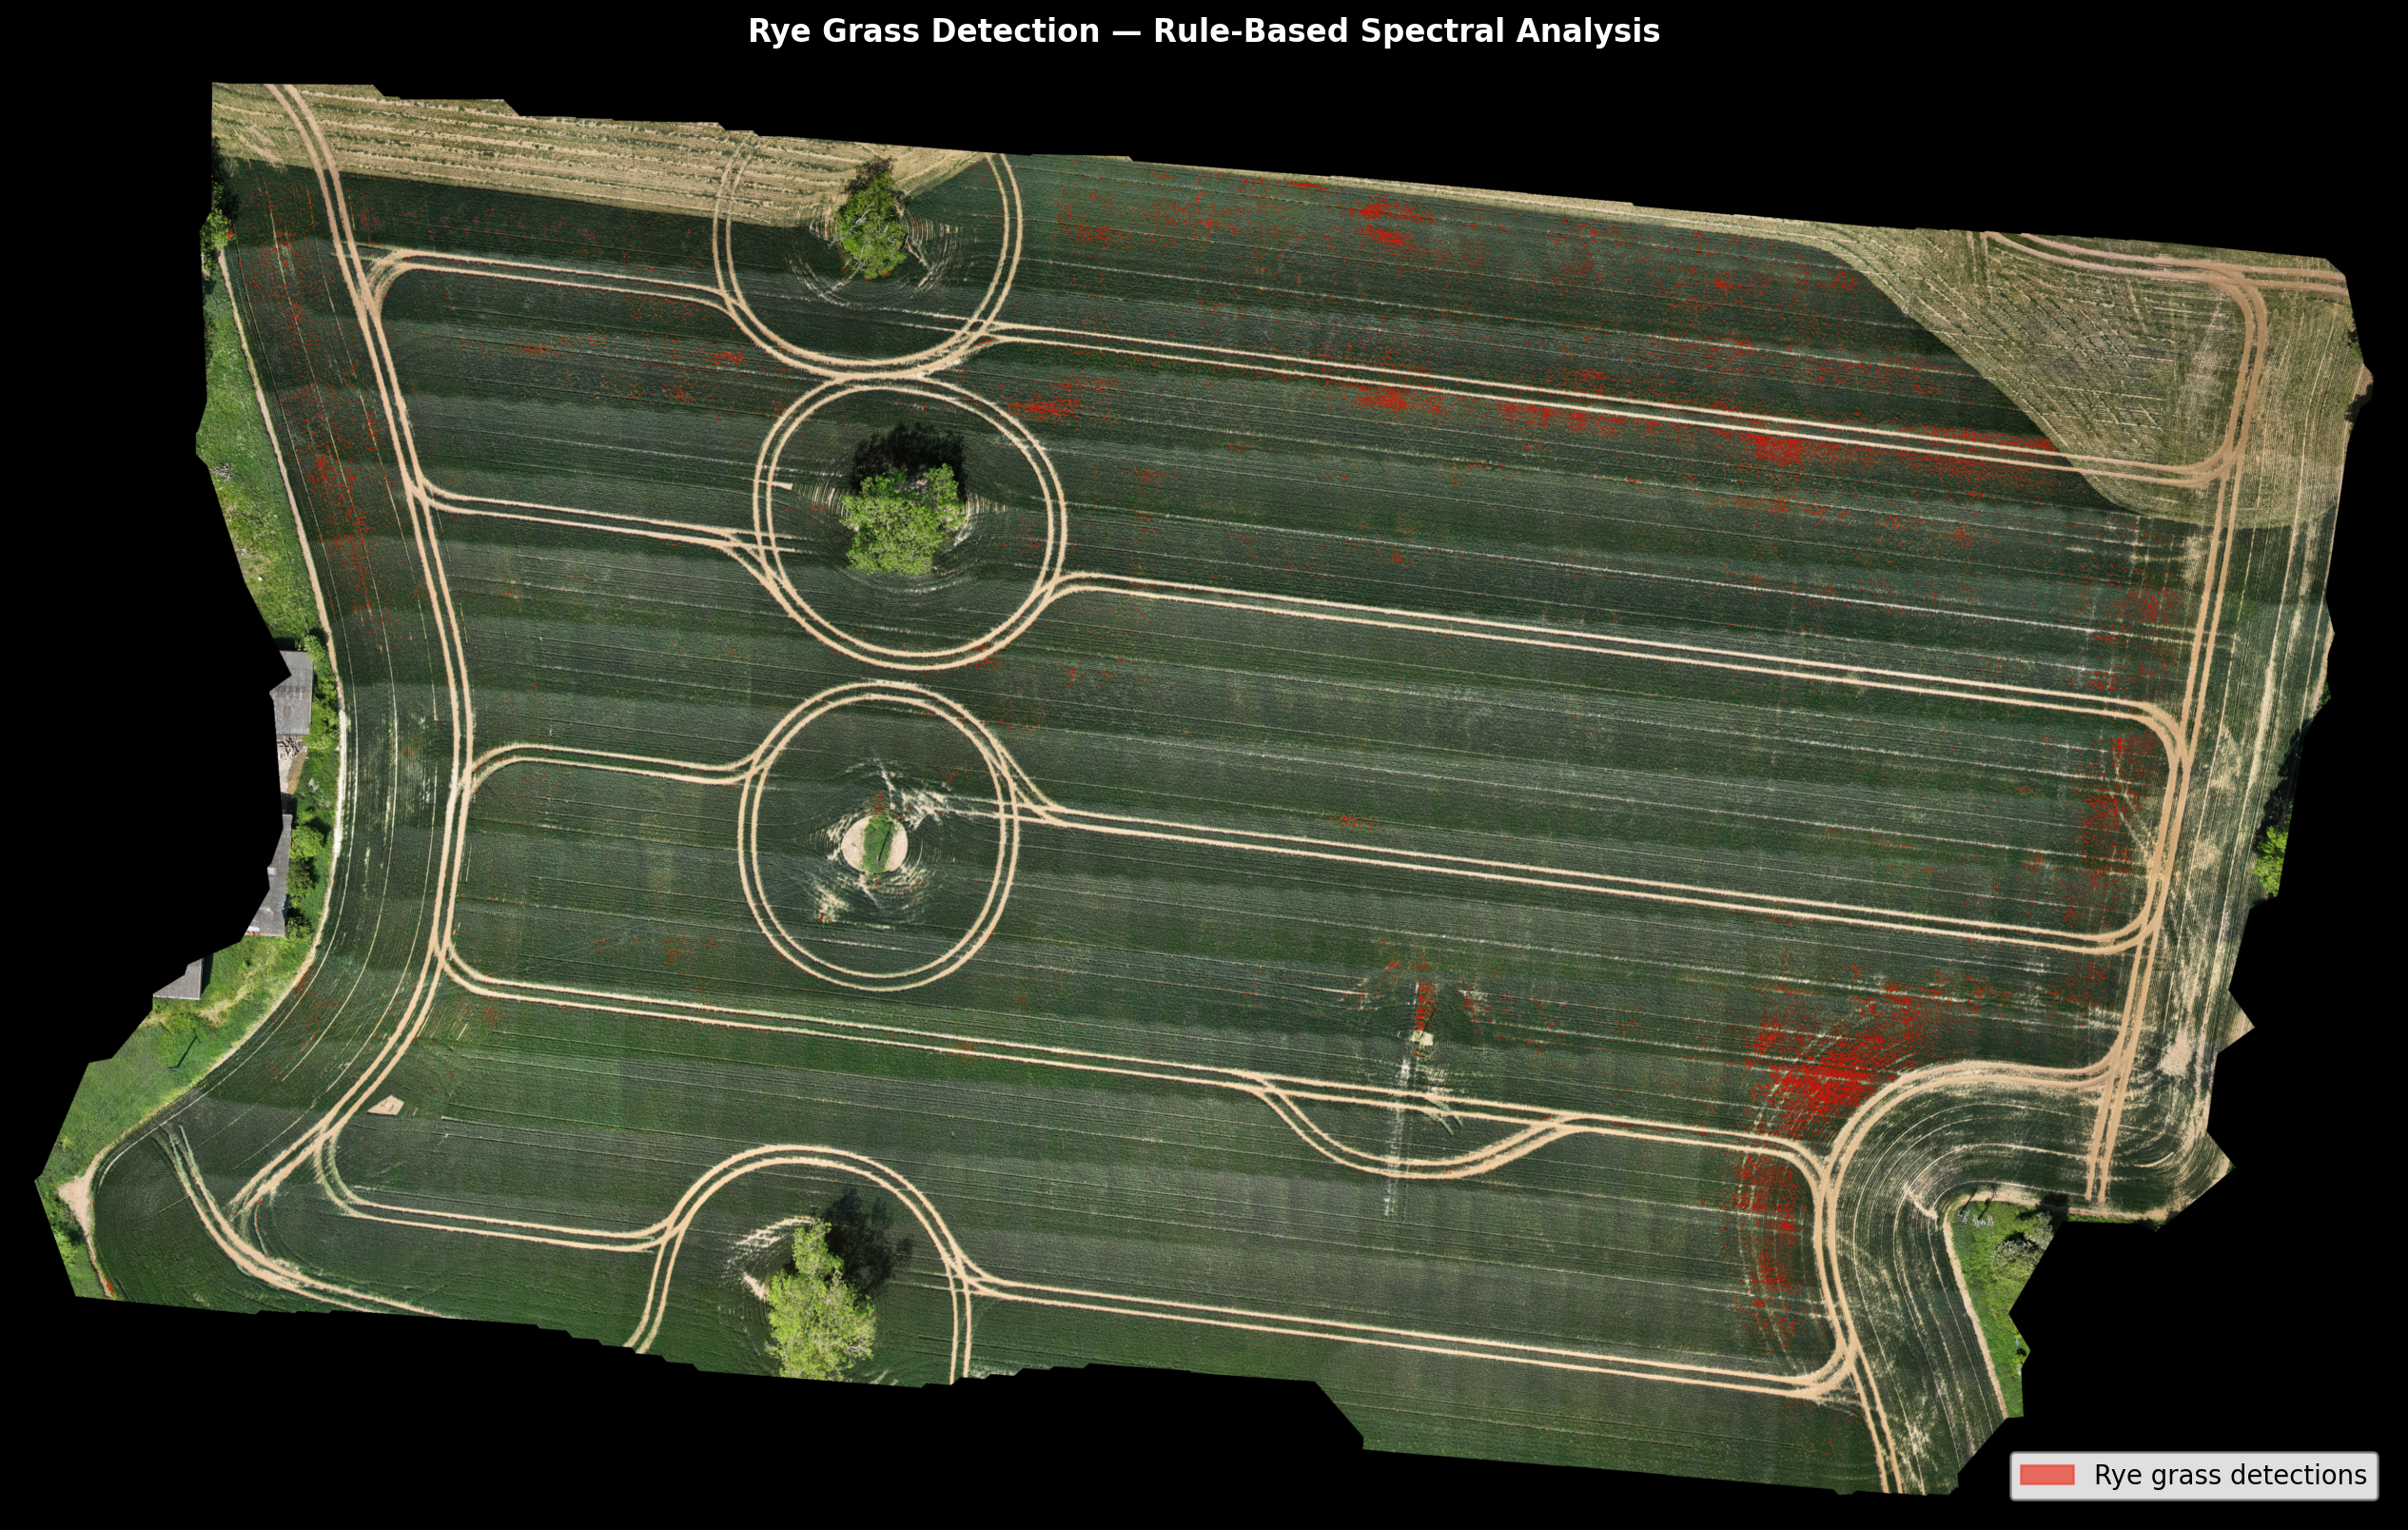
Rye grass density came back at approximately 4.5% of the surveyed area — distributed across the field rather than concentrated in any particular zone or tramline pattern. The prescription spray zone, accounting for a 25 cm buffer around each detection, covers 0.92 ha of the 4.70 ha surveyed.
What the prescription looks like in practice
The detection output feeds directly into a variable rate prescription. The achievable herbicide saving depends on the sprayer technology available:
| Sprayer technology | Spray area | Herbicide saving |
|---|---|---|
| Individual nozzle control at 25 cm | 1.58 ha | 67% |
| Individual nozzle control at 50 cm | 1.86 ha | 61% |
| Boom section control at 4 m sections | 3.20 ha | 34% |
These figures account for both the cross-boom nozzle resolution and the approximately 1 m forward resolution constraint imposed by GPS update rate and controller reaction time at typical field speeds. The prescription shapefile is delivered in a format compatible with all three scenarios — what the sprayer actually achieves depends on its hardware.
At a herbicide cost of around £70/ha, individual nozzle control at 50 cm spacing equates to a saving of approximately £43/ha in product cost alone. Across a typical farm with multiple affected fields, the survey cost is recovered comfortably on a single pass.
It's worth being clear about what this data can and can't tell you: the detection identifies where rye grass plants are visible from the air at a specific point in the season. Ground inspection of a sample of detections remains good practice before committing to a treatment programme, and the output is a starting point for agronomic decision-making rather than a replacement for it.
What happened next
The prescription shapefile was delivered alongside the survey report, ready for import into standard precision agriculture platforms. An ISOXML application map is available for direct upload to ISOBUS-compliant sprayer terminals.
With 15% of the field still uncovered, a follow-up flight is planned for when the interference issue is resolved. That data will be incorporated into the prescription when available.
One practical point on repeatability: the spectral thresholds are derived from this field at this growth stage. Re-flying next season, or flying a different field, involves a recalibration step — but that process is now well-defined and takes a fraction of the time the initial development required. The detection logic is fully documented and transferable.
Beyond weed control: additional value from the same flight
The multispectral data captured during this survey isn't limited to weed detection. The same NDVI and NDRE index maps that underpin the rye grass analysis also reveal crop vigour variability across the field — and that variability maps directly to nitrogen uptake.
This means the same flight data can be used to generate variable rate fertiliser prescription maps, targeting additional nitrogen to areas where the crop is behind and reducing it where the canopy is already strong. For a field with the variability seen here, that's a meaningful input saving and a yield protection measure from data that's already been collected.
In practice, one survey flight can deliver both a precision herbicide prescription and a variable rate nitrogen map — doubling the return on a single morning's data capture.
Data delivered
- Full PDF survey report covering detection statistics, patch distribution, coverage notes, and prescription methodology
- Filtered candidate raster (GeoTIFF, full resolution) — rye grass candidates, non-candidate vegetation, and field boundary
- Variable rate application prescription shapefile — spray and no-spray zones with 25 cm GPS buffer
- Spray zones only shapefile for QGIS overlay and sprayer import
- ISOXML application map for direct ISOBUS terminal upload
- Sprayer technology comparison — modelled savings at 25 cm nozzle, 50 cm nozzle, and 4 m section control
Survey flown and processed by McLaren Precision Agriculture Ltd. Client details withheld at the farm's request.